Activity 2
Placing Yourself on the Map
In this activity you will learn a bit about data wrangling and also critically consider how others see you as a digital self represented through digital mapping technologies such as coordinate systems. This page begins with guiding questions that ask you to consider how you are represented through digital mapping technologies and what ethical implications this also raises. Subsequently, an instructional video teaches you how to use an open source tool called GPS Visualizer to download your physical movement data from the OutdoorActive application and convert it from a GPX file to a CSV file. This will expose you to basic ideas related to data wrangling and also format your data for use in Activity 4. After this, another instructional video introduces you to key concepts central to digital mapping technologies in order for you to critically consider how you are represented to others through such technologies. This page concludes with different academic and news articles/media learners can explore prior to participating in this activity.
Guiding Questions
What is a map-based view-from-above of your movement?
How does a map-based view-from-above of your movement change your perspective on your personal geography, your daily rounds?
How might your personal geography look at different scales?
Given the power of coordinates and a map-based view of the world (and your place in it), what are the ethical implications of collecting precise locational data on individuals for the purposes of marketing and other commercial interests? Or for research purposes? How should consent be approached?
How to Wrangle Your Movement Data
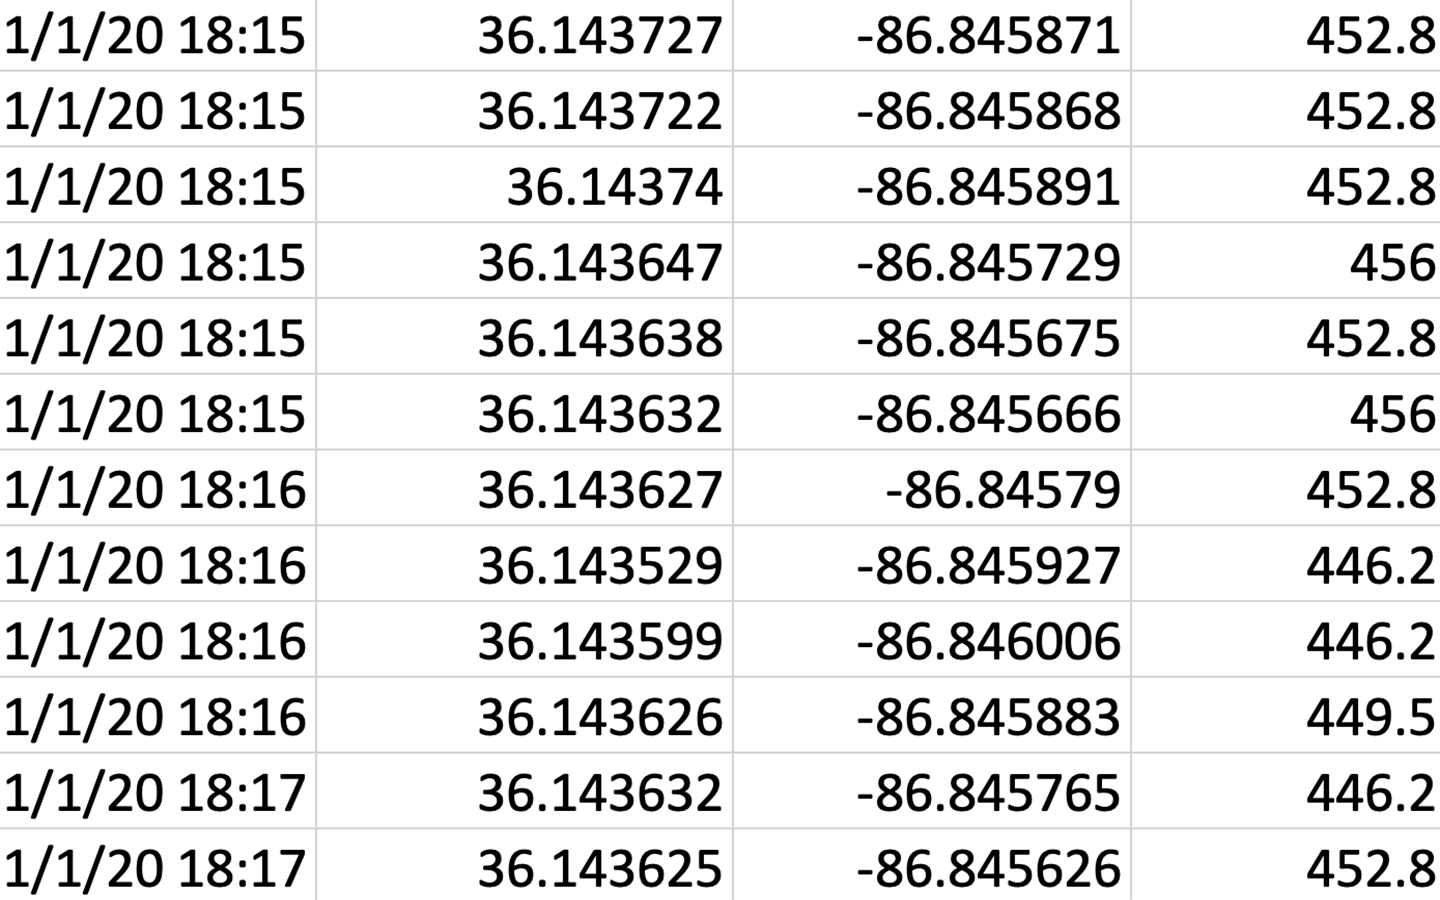
In this video Sierra Gilliam outlines how to download your physical movement data from OutdoorActive in a GPX file format and how to convert this data into a comma separated values (CSV) file using a tool called GPS Visualizer to support subsequent visualization of your data.
How to consider yourself in relation to the Map
In this video, Professor Steve Wernke provides a brief overview of key concepts central to technologies such as coordinate systems in order for you to critically consider how you are represented to others through such technologies.
Key Concepts
In the video by Professor Wernke, you saw how a map-based perspective enables recontextualizing of your personal geography. From your subject position “on the ground”, the world seems to just present itself in its sheer actuality. But from a map-based perspective, zooming in and out and viewing your movement data in relation to choropleth maps and other thematic layers can change your how you might understand your movement through the world. What looks “normal” on the ground, or from a close-in perspective can look atypical, or very limited and partial, from a regional perspective. Conversely, regional perspectives on your movement leave out many nuances of your daily rounds.
CSV (comma separated value) file: A CSV is a comma-separated values file, which allows data to be saved in a tabular format. It is a widely used file format and can be used with most any spreadsheet program, such as Microsoft Excel or Google Spreadsheets.
Coordinates: a set of numbers giving the precise location of a point, often its latitude and longitude.
Longitude & Latitude: Longitude is the measurement east or west of the prime meridian. Longitude is measured by imaginary lines that run around the Earth vertically (up and down) and meet at the North and South Poles. These lines are known as meridians. Each meridian measures one arcdegree of longitude. The distance around the Earth measures 360 degrees. Longitude is related to latitude, the measurement of distance north or south of the Equator. Lines of latitude are called parallels. Maps are often marked with parallels and meridians, creating a grid.
Map Projection: a method for taking the curved surface of the earth and displaying it on something flat, like a computer screen or a piece of paper.
Readings
News, Media & Videos
Interactive website The True Size Of, which enables you to experiment with the distortions of the Mercator projection