Visualize
Mapping self in society
Overview
Import your GPS data into the IGS visualization tool to map your daily movements, then overlay thematic maps to see how your personal geography intersects with broader social patterns in your community.
How to Complete This Activity
Export Your GPX Files
First, export your recorded tracks from OutdoorActive as GPX files. Open each track, tap share/export, and select GPX format. Watch the video below for a walkthrough.
Open the IGS Visualization Tool
Go to interactiongeography.org and launch the IGS tool. Click the preview below to open it. Take a moment to explore the interface—notice the map view, time controls, and layer options.
Import Your GPX Files
Click the import button and load your GPX files. Your movement tracks will appear as colored paths on the map. If you have multiple days of data, import them all to see your full pattern.
Explore Your Movement
Use the map view to see your tracks at different scales. Try the time slider to watch your movement unfold chronologically, and the space-time cube to see patterns in 3D. Notice: Where are the dense clusters? What routes do you repeat? Where are the gaps?
Optional: Compare with Thematic Maps
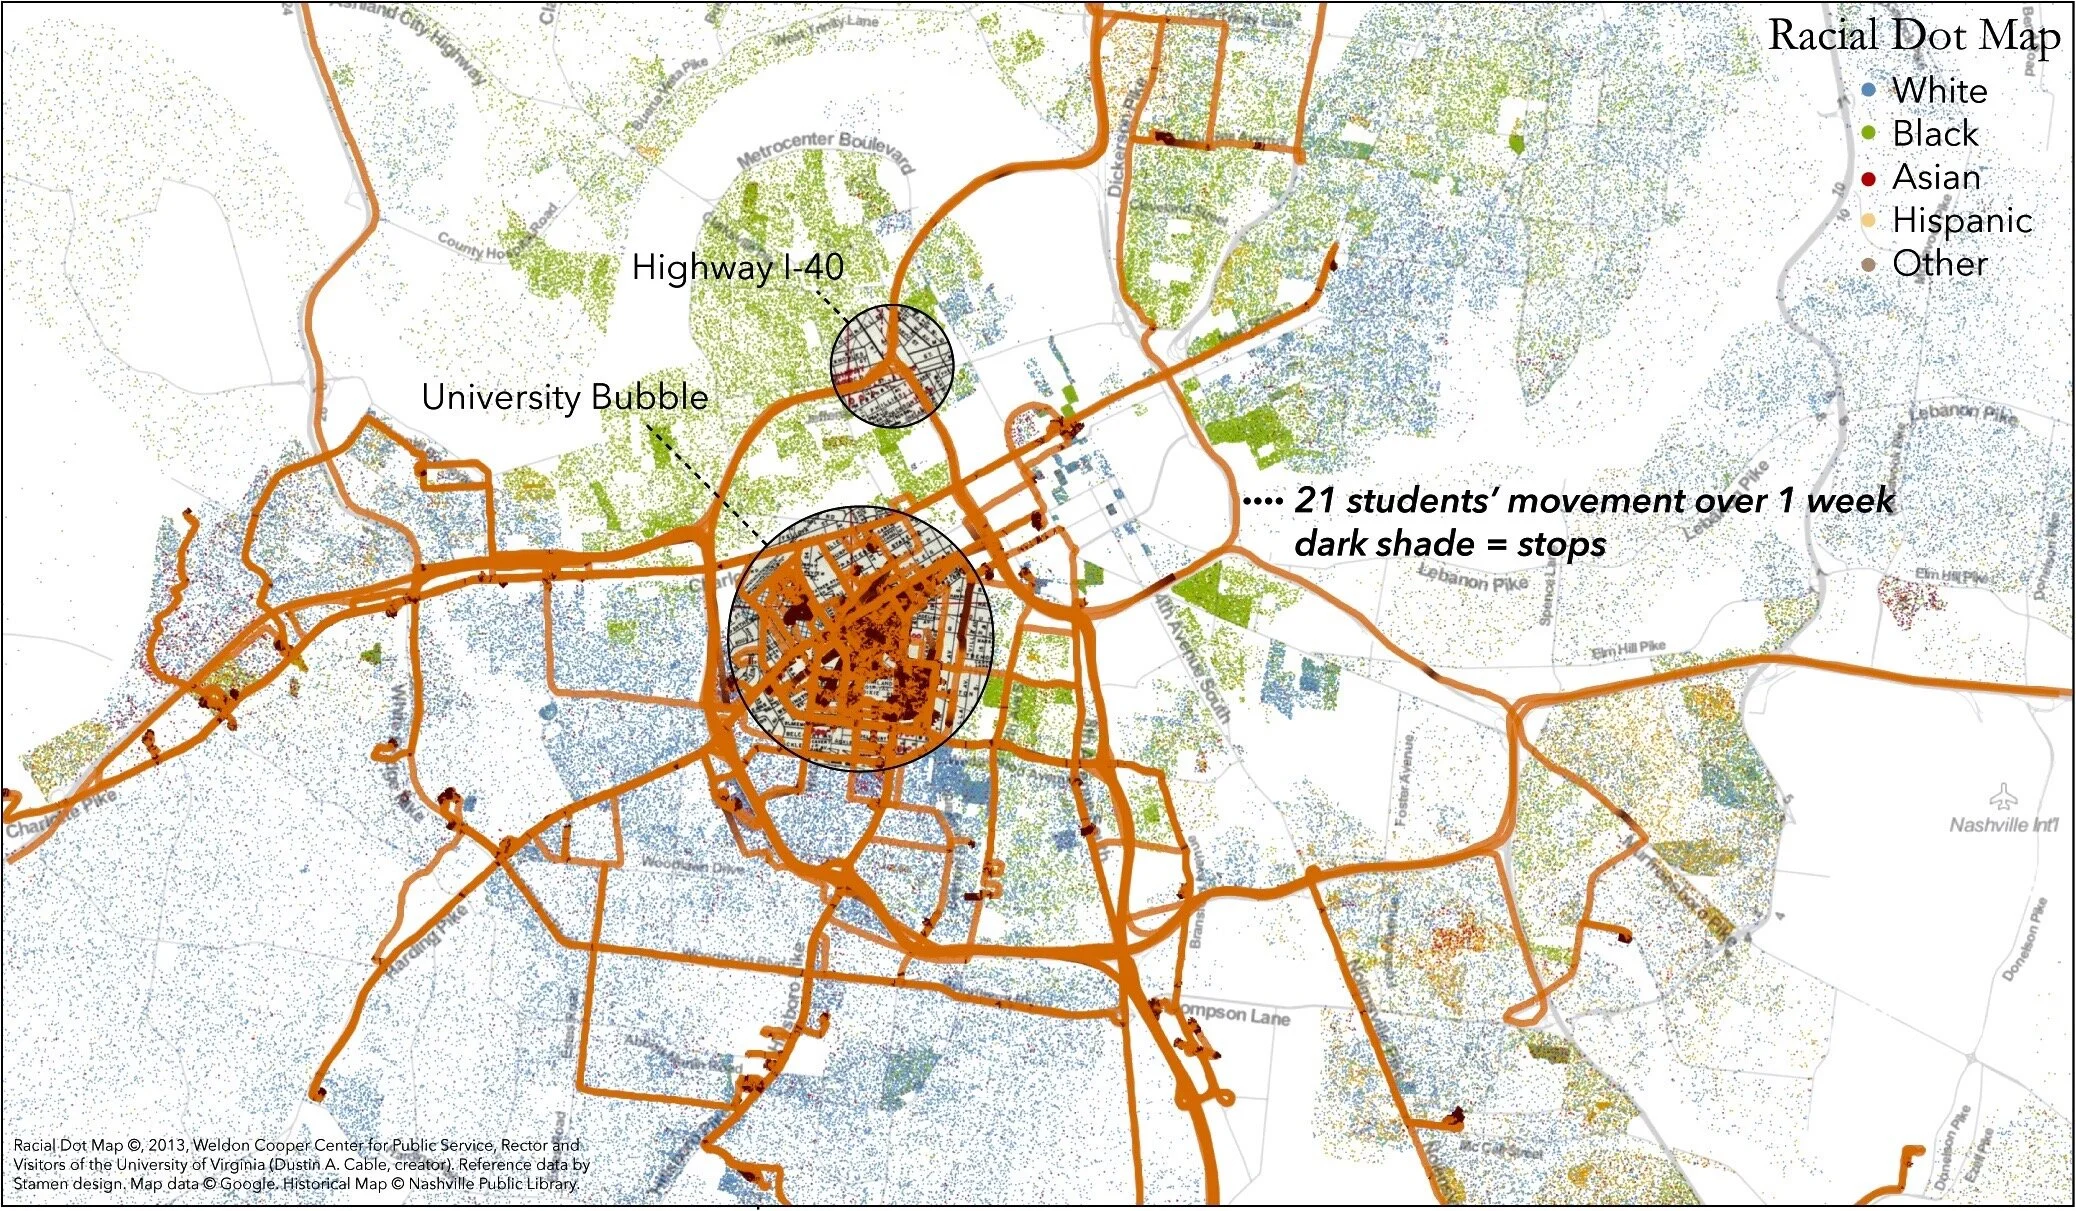
To deepen your analysis, consider overlaying thematic maps that show social data for your area—income levels, demographics, historical redlining, environmental data, and more. You can download ready-made thematic maps from the spreadsheets below. Watch the video to learn how thematic maps work and how to use them effectively.
Document Your Observations
Take screenshots of meaningful views. Write down 3-5 key observations about what you see. What does your movement reveal when placed in social context? What questions do these visualizations raise?
Important Considerations
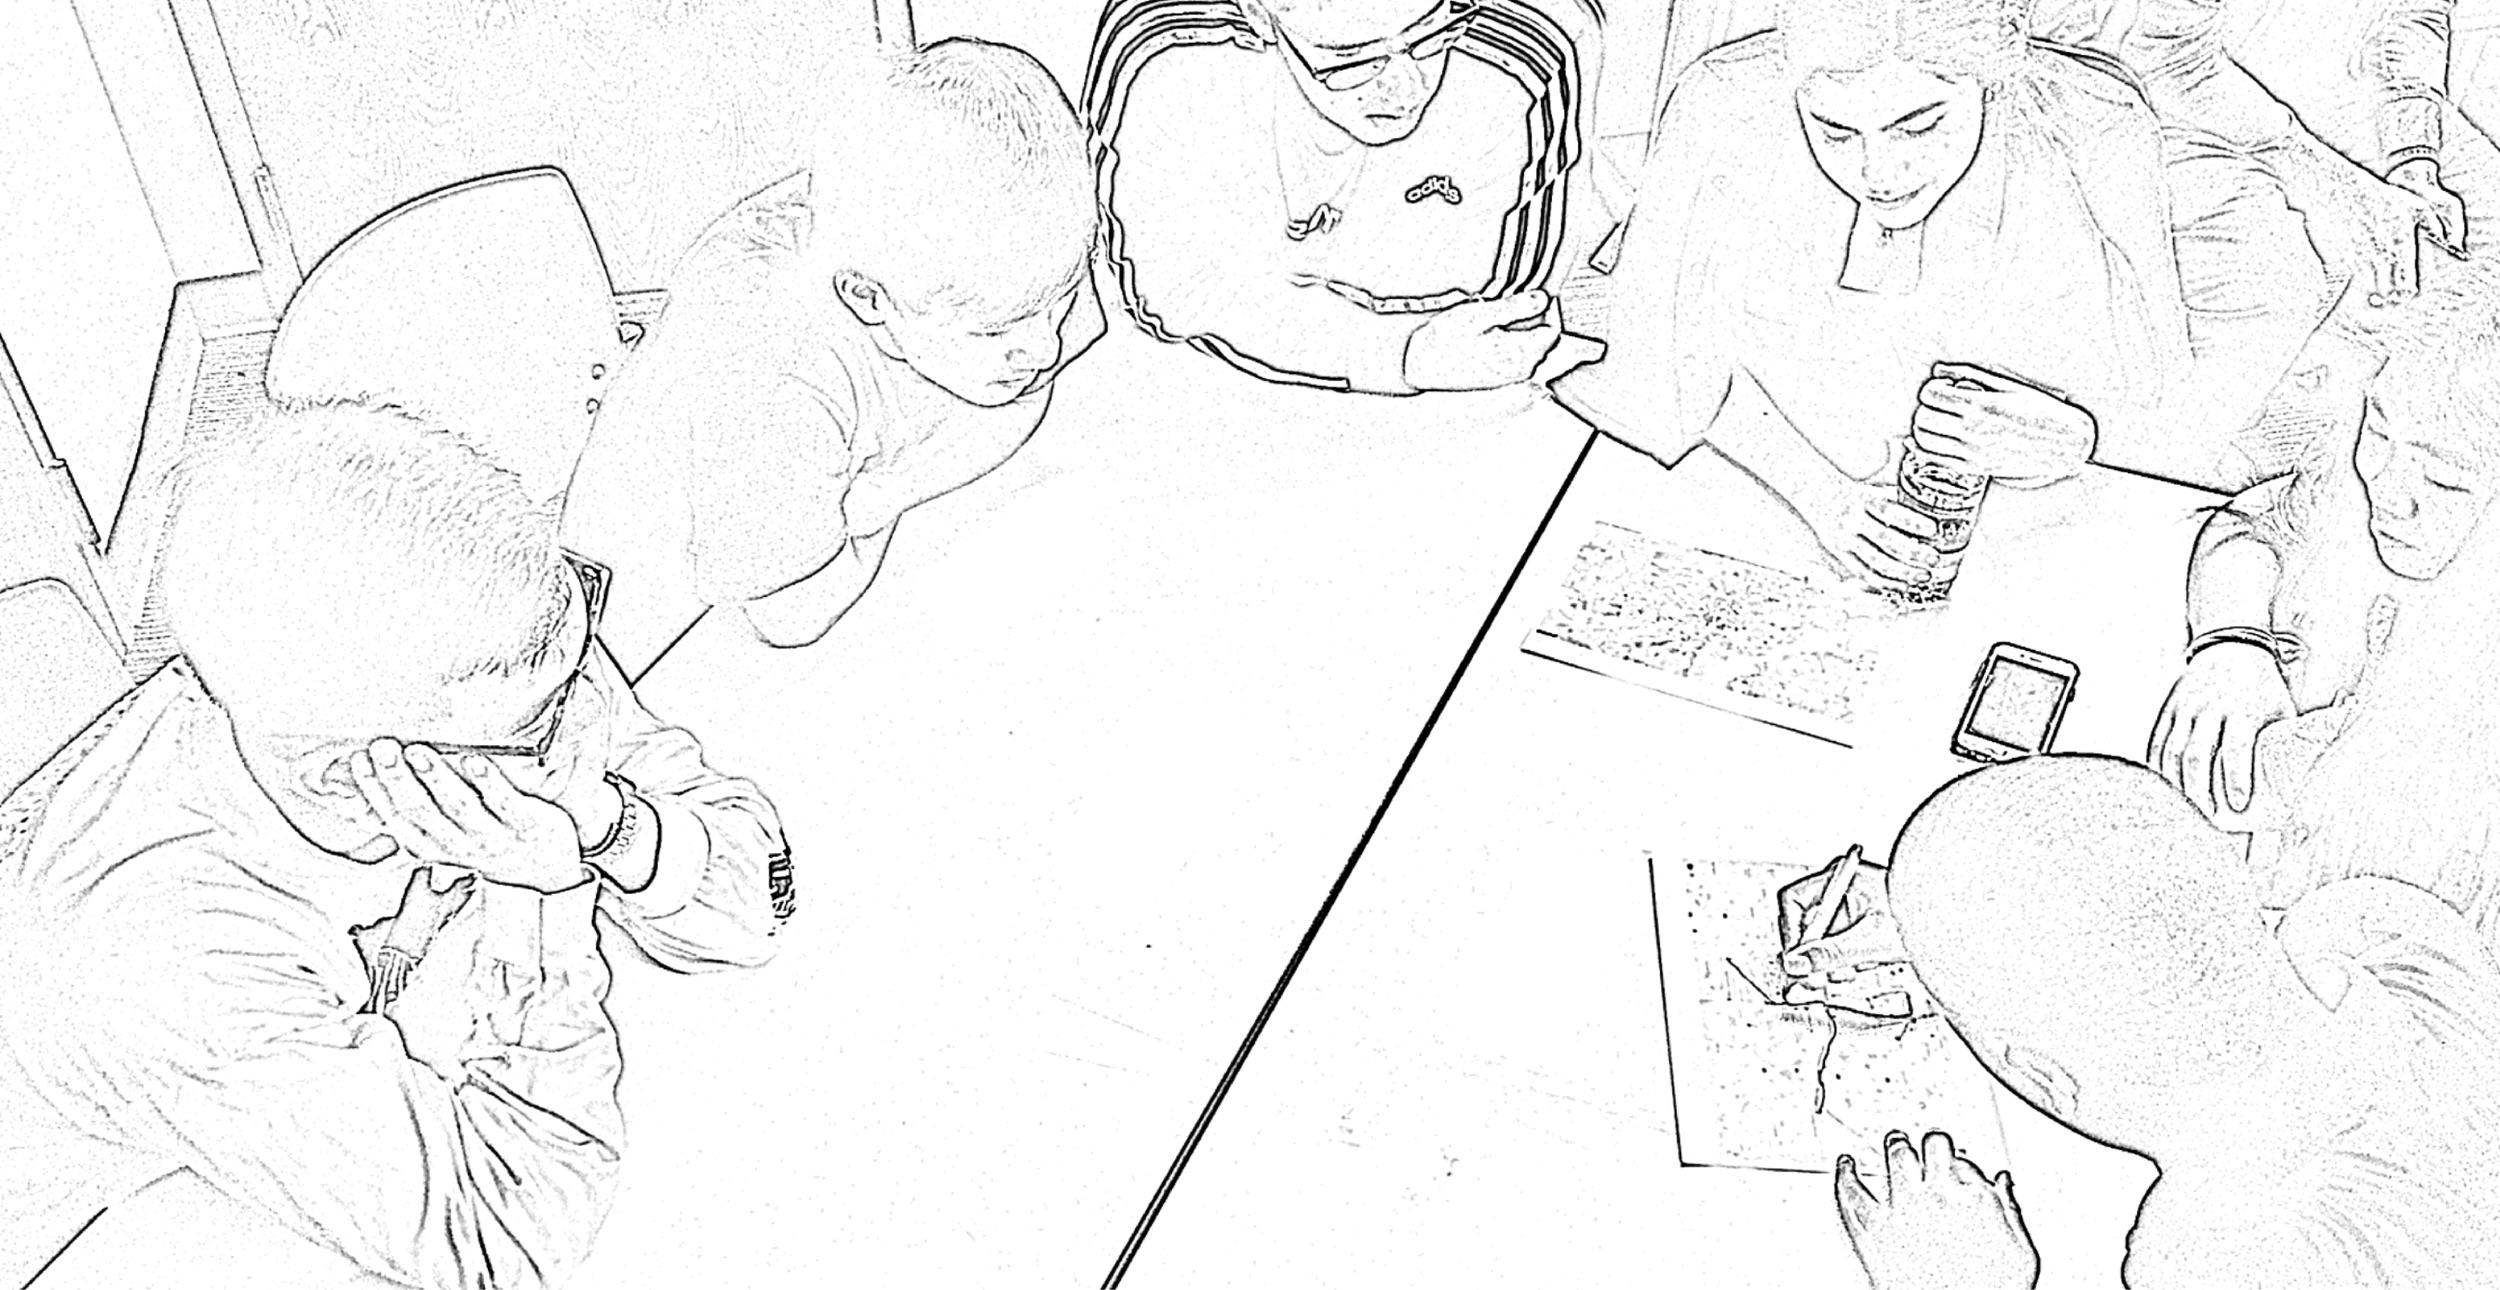
- Seeing your movement from above can feel strange or revealing—this is normal. Take time to process what you see.
- Maps are not neutral. They reflect choices about what data to show, what colors to use, and what boundaries to draw.
- Historical maps (like redlining maps) show how past policies continue to shape present-day geography.
- When sharing visualizations, you control what to show. You can zoom to hide specific locations or share patterns without revealing exact addresses.
Guiding Questions
How does seeing my movement on a map differ from my ground-level experience?
What spaces do I access or avoid, and why?
How does my personal geography relate to patterns of inequality in my community?
What historical patterns visible in maps still affect my neighborhood today?
What does it mean to see myself as data within larger social systems?
Key Concepts
Thematic Map
A map designed to show a particular theme or subject area, such as population density, income levels, or historical boundaries.
Space-Time Cube
A three-dimensional representation showing movement across both space (x, y) and time (z), revealing patterns in daily routines.
Activity Space
The locations an individual has direct contact with during daily activities, shaped by both choice and constraint.
Critical Cartography
An approach examining the power relations embedded in maps, questioning whose perspectives are represented.
Spatial Inequality
The unequal distribution of resources and opportunities across geographic space, often visible through thematic mapping.